
A/B test for a premium industrial coatings retailer revealed a surprising insight: displaying 5-star customer reviews outperformed technical durability messaging by a staggering 90.2%. Even for highly technical products like marine and pool paint, social proof proved more persuasive than performance specifications. This case study demonstrates how proper review positioning can dramatically impact conversion rates and revenue, challenging conventional wisdom about marketing technical products. Find out how we implemented this strategy and the specific results we achieved.
Highlights
Despite selling technical products that need strong social validation, our client’s review presentation wasn’t converting effectively. Using our proprietary testing tool Nantu, we compared two distinct approaches: durability-focused reviews highlighting technical performance metrics versus traditional 5-star reviews emphasizing customer satisfaction. The test revealed an impressive 90.2% conversion lift for the 5-star review variation – though as we explain in our “Reality Check” section, such dramatic short-term results should be interpreted cautiously. What matters most is that we established with high confidence (96%) that customer satisfaction ratings outperform technical durability claims, even for specialized industrial products.
Key Wins:
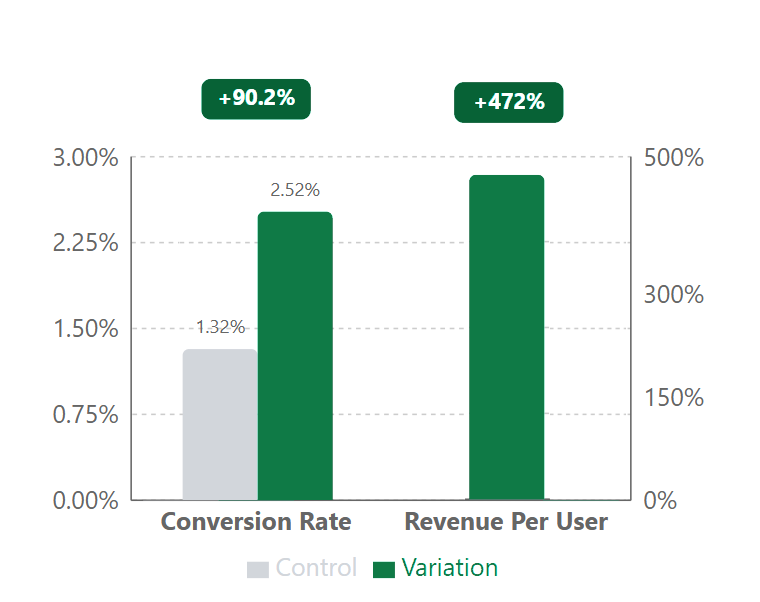
- Conversion rate jumped from 1.32% to 2.52% (90.2% lift)
- Transaction volume doubled, increasing from 11 to 22 orders
- Revenue per user increased by nearly 5X
The Challenge
The client faced a common but critical challenge: their product reviews weren’t effectively communicating value to potential customers. With specialized technical products like marine and pool paint, durability is key - but their current review display wasn’t helping customers make confident purchase decisions.
Previous tests had shown promise with both durability-focused reviews and 5-star reviews. The question was: which approach would drive the best results for these highly technical products?
Our Solution 💡
After analyzing previous test results and customer behavior, we designed a focused A/B test to determine the most effective review display strategy for technical products.
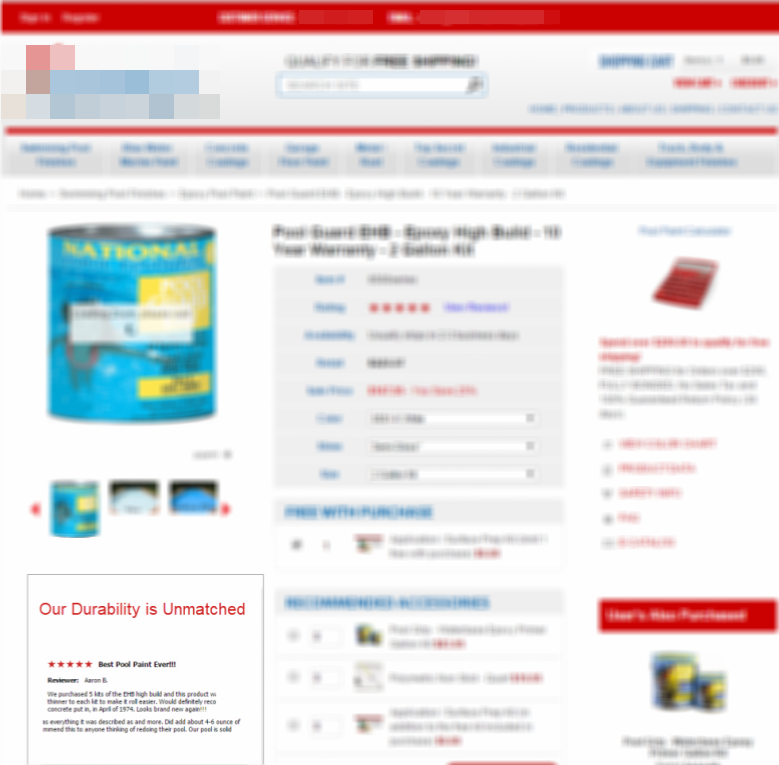
- Control Version: Durability-focused reviews that highlighted specific technical performance metrics and longevity claims
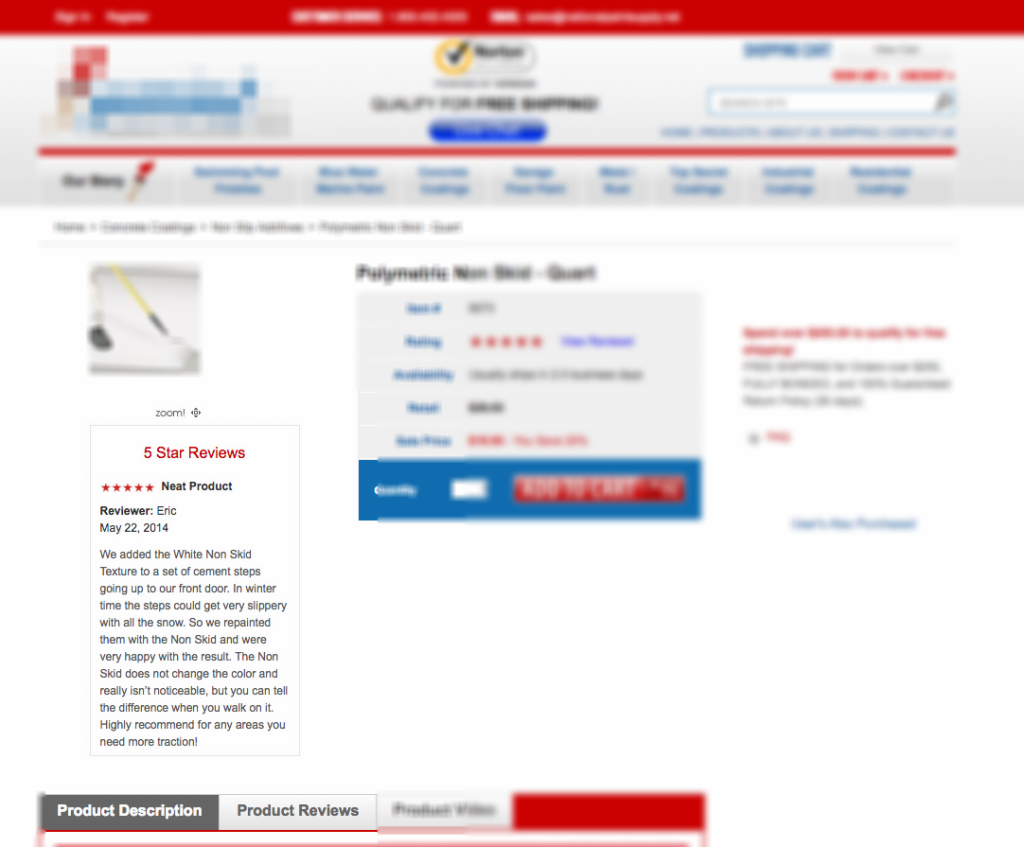
- Variation Version: Displayed traditional 5-star reviews that emphasized overall customer satisfaction and experiences
- Test Scope: Targeted all marine and pool paint product pages
- User Base: Included both desktop and mobile visitors to ensure comprehensive results
Technical Implementation ⚡
To ensure clean data collection and reliable results, we created a streamlined testing environment using enterprise-level tools and methodology. We utilized Nantu for precise deployment and tracking while implementing cross-device compatibility with responsive design. Our setup included even traffic distribution between variants and specific triggering configured exclusively for product pages, ensuring the test targeted only relevant user journeys.
- Test included full user journey tracking from product page view to purchase completion
- Implemented cookie-based user identification to ensure consistent experiences across sessions
- Employed real-time data validation to monitor for anomalies throughout the test period
The Results
| Metric | Control | Variation | Lift |
|---|---|---|---|
| Users | 831 | 874 | — |
| Transactions | 11 | 22 | +100% |
| Conversion Rate | 1.32% | 2.52% | +90.2% |
| Revenue Lift | — | — | +501.5% |
The results were impressive- customers really responded to seeing star ratings instead of technical specs. Our traffic stayed about the same, but conversions nearly doubled from 1.32% to 2.52%. Revenue shot up by 501.5% which was a pretty extreme result. Turns out, even for technical products like marine paint, buyers trust what other customers say more than durability claims.
Reality Check
That said, let’s keep it real - while these results are exciting, we wouldn’t expect to see a sustained 500% revenue jump from this test alone. Test results, especially from shorter periods and on smaller samples like this one, can show amplified outcomes due to the sample size and timing. What matters most is that we’re highly confident (96%) that showing star ratings performs better than focusing on durability claims. Could we get a more precise estimate of the long-term lift by running the test longer? Sure, but there’s a trade-off. Longer tests mean delaying the rollout of what we already know works better, and in our experience, that opportunity cost usually isn’t worth it.
Why It Worked 🎯
The results challenged conventional wisdom about technical products. Here’s what we learned:
- Social Proof Trumps Technical Detail: Even for specialized products, customers responded more strongly to overall satisfaction ratings than specific durability claims.
- Higher Purchase Confidence: The doubling of transactions shows that 5-star reviews gave customers the confidence they needed to commit to purchase.
- Larger Purchase Values: The dramatic revenue increase wasn’t just from more sales—customers were spending more per order with the new review format.
Let’s Talk 💬
Ready to unlock dramatic revenue improvements with data-driven CRO? Let’s discuss how we can apply these insights to your e-commerce strategy.
Appendix: Detailed Test Parameters and Statistical Analysis
| Test Parameters | Details |
|---|---|
| Device targeting | Desktop and mobile |
| Page scope | Product pages for marine and pool paint |
| User segments | All visitors to targeted product pages |
| Test duration | 25 days |
| Sample size | 1,705 total users |
| Confidence level | 96% |
| Participation rate | Evenly distributed between control and variation |
The best CRO agencies chase free wins first - reordering the reviews already on this page nearly doubled conversions, with no new design.