One Simple Product Position Change Drove 27.6% Revenue Growth for Cybersecurity Leader
The Client
Enterprise Network Protection Specialist
Executive Summary
Enterprise cybersecurity provider specializing in vulnerability management. Simple product position swap showing premium "Expert" version before standard "Pro" option led to 28.9% conversion increase and 27.6% revenue growth with 99% confidence.
A leading enterprise cybersecurity company was struggling with suboptimal selection rates for their premium "Expert" version of their vulnerability scanner software. Many customers defaulted to the less expensive "Pro" version simply because it appeared first on the page.
We implemented a straightforward test that swapped the positions of the two product offerings, displaying the premium "Expert" option before the standard "Pro" option. This simple change had a dramatic effect on purchasing behavior.
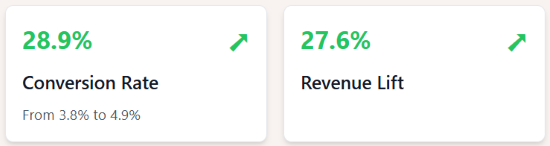
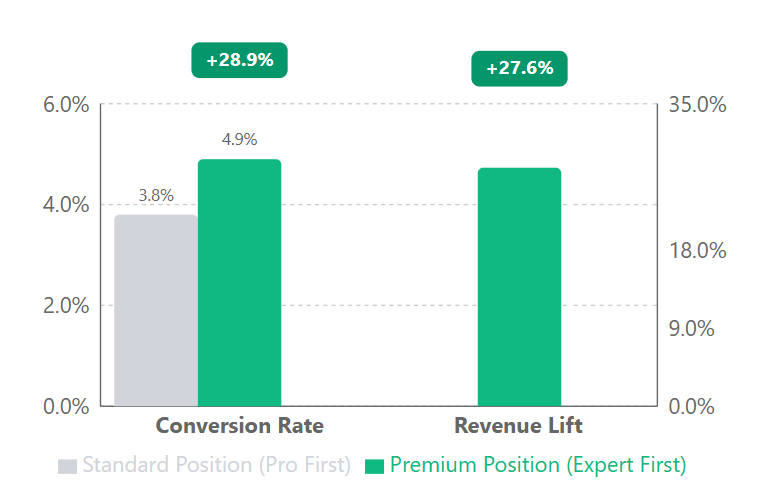
28.9% increase in conversion rate (from 3.8% to 4.9%)
27.6% uplift in revenue per user with 99% statistical confidence
22% lift in revenue projections, translating to significant additional income
Our Strategy 💡
Our hypothesis was simple: By repositioning the premium product (Expert) before the standard product (Pro), we could increase visibility of the higher-priced option and drive more customers to select it.
The implementation was straightforward:
Swapped the positions of the two product offerings on the page
Maintained identical content and pricing for each product
Ran the test across all devices with no specific user segmentation
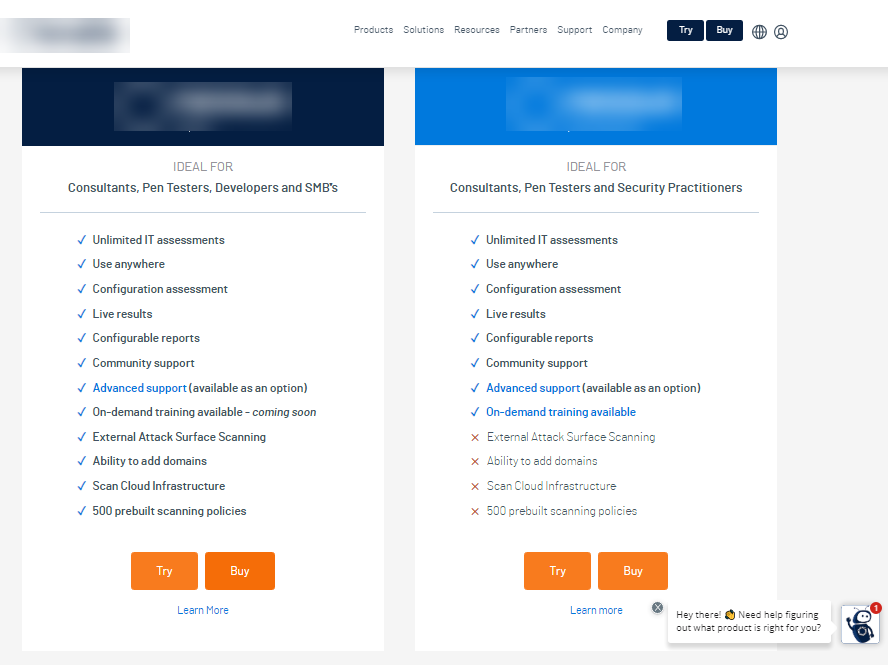
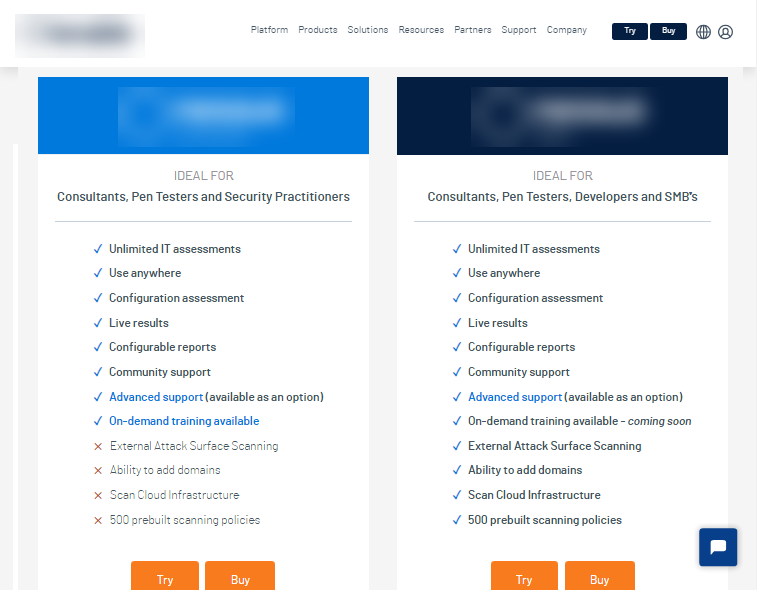
Control: Standard product arrangement with the lower-priced "Pro" option displayed first, causing customers to default to the less expensive choice despite the premium "Expert" version offering substantial additional value for their security needs.Variation: Strategic repositioning with the feature-rich "Expert" version displayed first, creating an anchoring effect that shifted perception of the standard option from default to compromise choice, driving a 27.6% revenue increase.
The Results
Metric
Control
Variation
Lift
Users
11,166
10,940
-
Transactions
428
535
-
Conversion Rate
3.8%
4.9%
28.9%
Revenue Lift
-
-
27.6%
Reality Check
While these results are impressive, we made sure to advise the client that they shouldn't count on a 28.9% conversion rate lift with a 27.6% revenue increase. Test period results can sometimes show exaggerated outcomes due to sample variability and the shorter measurement window.
What's most important here is that the test version performed statistically better than the control with 99% confidence. If you wanted a more precise estimate of long-term revenue lift, you'd need to run the test longer—but this comes with trade-offs. Longer tests delay rolling out the winning version, and in this case, the opportunity cost of waiting wasn't worth it given the clear statistical significance.
Why It Worked 🎯
By positioning the premium option first, we created an "anchoring effect" where users calibrated their expectations based on the higher price point, making the standard option appear as a compromise rather than a default.
Let's Talk 💬
Want to see how our analytical approach can boost your conversion rates and revenue? Get in touch for a free strategy session where we'll break down your current funnel and identify quick wins for immediate growth.
Appendix: Detailed test parameters and statistical analysis
Test Parameters
Parameter
Value
Devices
Desktop, tablet, and mobile
User Segments
All visitors to product page
Duration Criteria
Statistical significance or minimum of two weeks
Tracking
Unique promo codes for each product's CTA buttons
Variation Elements
Product display order only
Statistical Analysis
Statistical Summary Metrics
Value
Confidence level
99%
Z-score
3.85
P-value
0.0000597
Conservative lift estimate
22%
Sample size
22,106 users combined
Test duration
25 days
Participation rate
Not provided
Field Notes
"Information hierarchy matters quite a bit when you're trying to get users to do what you want. Marketers should be constantly testing the position of elements and CTAs to improve conversion"
Devon Cox
President, ConversionTeam
NEXT STEPS
Let’s Talk Conversion
Ready to see if our companies are a good fit? Get a free Quick Wins CRO Audit or reach out to start a conversation
This website stores cookies on your computer. These cookies are used to collect information about how you interact with our website and allow us to remember you. We use this information in order to improve and customize your browsing experience and for analytics and metrics about our visitors both on this website and other media. To find out more about the cookies we use, see our Privacy Policy.OkPrivacy policy